
Event analysis with Jamf telemetry
Endpoint telemetry is crucial for securing your device fleet. Learn how Jamf can help your organization analyze a variety of events.

Intro
In today’s evolving digital landscape, ensuring the security and performance of every device in your organization is more important than ever. In a recent blog post, we highlighted the critical role Mac endpoint telemetry plays in providing valuable insights that empower Security and IT teams to proactively manage and protect Mac devices using some of the following categories:
- Application and processes
- Process execution
- User and groups
- User added to group
- User has changed their password
- Access and authentication
- User login and logout
- Users using OpenSSH
- Users using screensharing
- Persistence
- Creation of LaunchAgents or LaunchDaemons
- Removal of LaunchAgents or LaunchDaemons
The telemetry feature in Jamf provides a wide range of events to analyze. To help you get started, this blog post will outline a few use cases that you may find helpful after enabling this new feature. This blog provides example queries for Google Security Operations. Google SecOps is a threat hunting platform that Jamf Threat Labs uses to help keep customers safe. It allows us to search and detect anomalous activity within our unique Apple specific dataset.
Before we begin, it's worth noting that by default, telemetry does not calculate file hashes for all process executables. To enable this, navigate to the telemetry configuration page in the Jamf console and check the File Hashes option under Advanced Logging. File hashes serve as unique fingerprints for executables, and in the next section, we’ll explore why collecting them is crucial for investigations.
Use Case 1: Hash lookup
With access to a vast amount of telemetry data, security teams must be able to query newly identified malicious threats. One of the most effective ways to do this is by leveraging file hashes, which act as unique fingerprints for executables.
By collecting file hashes, you can quickly search for known malicious process execution within your organization. For example, in Google SecOps, we can query execution (exec) events where exec.target represents the executed process, and its hash is mapped to target.process.file.sha1 (or target.process.file.sha256).
Beyond real-time detection, telemetry data also provides historical visibility and searchability. If a new indicator of compromise (IOC) emerges, we can retroactively search past telemetry logs to determine if the threat existed in our environment before it was identified as malicious.
In the predicate above, note that the source process and principal (responsible) process may also have associated file hashes. Later in this article we will discuss how to investigate an event's related processes.
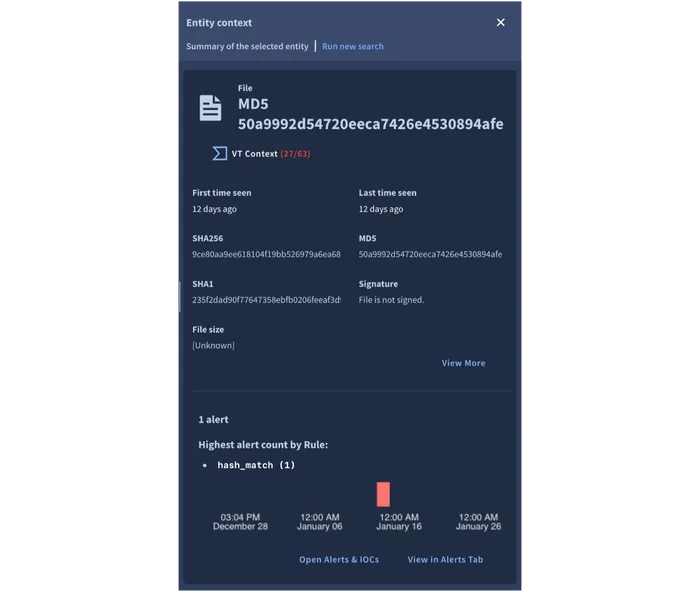
The inverse of this process also provides valuable insight. For example, if you find an interesting process in telemetry data, you can then check the hash of that process against the Threat Intelligence community. Checking a hash against community malware databases like VirusTotal is one of the easiest ways to get valuable details about a file all in one place. These platforms aggregate intelligence from multiple security vendors, helping analysts quickly determine whether a file is known to be malicious.
For example, the image below from Google SecOps highlights VT Context, where 27 out of 63 security vendors have flagged a particular hash as malicious.
Hashes are extraordinarily useful for detecting known malware, but what about threats that haven’t been identified yet? Relying solely on hash lookups means newly emerging malware or modified variants could go unnoticed.
In the following sections, we’ll explore queries designed to detect suspicious activity through behavioral analysis, allowing us to uncover threats even when a known malicious hash was not involved.
Use Case 2: Infostealers... yes really
Stealers are all the rage these days, and wouldn’t it be nice to have a detection ready to add to your arsenal? A hallmark of this type of malware is an AppleScript dialog box prompting the user for their password, a simple yet effective technique used by attackers to harvest credentials. AppleScript (osascript) comes preinstalled with macOS, making it an attractive tool for malware authors to exploit without the need to drop additional payloads.
Static detections are a great first line of defense, but malware authors actively evolve their techniques to evade them. One common method is obfuscating their execution paths and payloads to prevent straightforward detections. For example, attackers may dynamically construct or encode their AppleScript payloads to make it difficult to statically detect their invocation.
To counter this, we need to rely on behavioral detection. For this detection, we will check where target.process.file.full_path is /usr/bin/osascript and the command-line arguments contain "display dialog" and "password". This detection will identify events in which an end-user was presented with an AppleScript dialog box requesting their password.
By focusing on behavior rather than static indicators, we can adapt to new variants and ensure that our defenses remain effective against evolving threats. In the screenshot below, the discussed query has been translated for SecOps and has returned a matching event as a result.
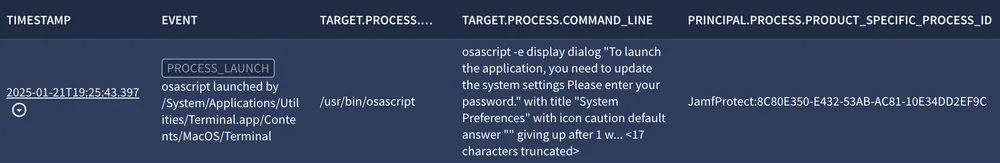
The above image contains the results of a SIEM search in Google SecOps.
Query — Google SecOps
Use Case 3: OpenSSH brute force
Attackers often identify exposed ports associated with common remote access services such as SSH. Upon identifying one, they may attempt to gain access through brute-force attacks. On many macOS systems, end users have administrator permissions, making it easy for them to open ports like 22 for SSH, whether for remote access, troubleshooting or other legitimate reasons. However, they might forget to close the port, unintentionally exposing their system to external threats.
It is common for employees to remotely log in to access company resources, making these endpoints attractive targets for dictionary/brute-force attacks. The predicate below returns authentication failures tied to the openssh_login event, including critical details such as the source (origin) IP and geo-location, revealing the public IP address of where the inbound traffic is coming from.
By leveraging enrichment options in a SIEM like Google SecOps, we can quickly identify the country from which the login attempts originated. If the traffic is coming from a country where the employee is not known to be working from, it can immediately raise suspicion. This information allows security teams to distinguish between legitimate user activity and unauthorized access attempts, enabling faster and more effective threat response.
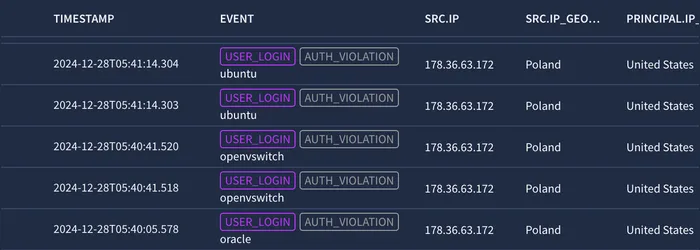
Above, the query's results are shown. Take a look at the columns titled "EVENT" and "SRC.IP_GEO_ARTIFACT.LOCATION.COUNTRY_..." in the results. We can see there that there are failed attempts from remote IP addresses that are related to an attempt to connect using SSH; another indicator is the usernames that are not pointing to the actual end user of that system but service accounts that potentially can exist. Google SecOps enriched the country based on geolocations from the source IP, and with all these indicators we can conclude an attempted dictionary attack has taken place.
Query — Google SecOps
Next, we will explore the actions a security analyst monitoring telemetry data may take to determine exactly what happened on the targeted machine after the attack was carried out. By analyzing telemetry data, we can reconstruct the attack timeline, identify any malicious processes or commands executed, and uncover indicators of further compromise. This investigation will, in turn, inform the necessary remediation actions, ensuring that threats are properly contained and mitigated.
Responsible Process Timeline
Each of the previous use cases led to a similar conclusion: an incident has been identified, and the next step is to determine exactly what happened afterward. The most effective way to do this is by retrieving all events generated by the process responsible for the alert. These events provide crucial context, capturing activity both before and after the triggering event, allowing analysts to reconstruct the full chain of events and gain a clearer understanding of how the incident unfolded.
A query that retrieves all events tied to the responsible process can be constructed using a single field. Let’s examine the event snippet below as an example. This will help illustrate how we can query for all related events, providing deeper insight into the process’s behavior before and after the incident.
The responsible audit token's UUID is the key piece of information needed to look up all recursive actions performed under a given process including its child processes. This unique identifier allows us to track all events tied to the responsible process, helping us reconstruct its activity. Jamf Protect enhances Apple’s ES API by assigning this unique UUID to every process execution.
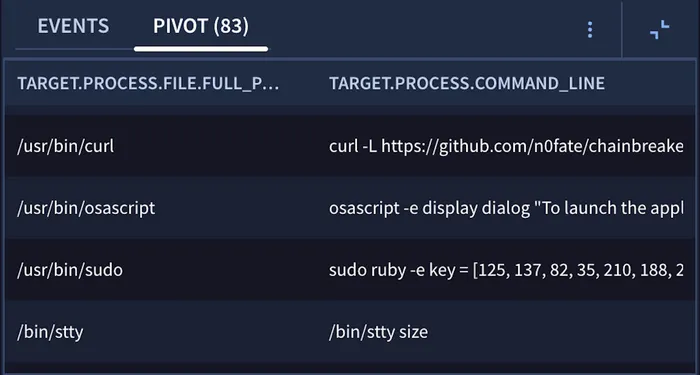
Once the UUID has been identified, we can build a query to trace how a process was launched, identify its parent, and follow the chain further back to uncover the origin of suspicious activity. Since every event generated by the responsible process shares this same UUID, the query only needs to filter on this single field to gather the full execution context. Using the query below allows you to pivot in Google SecOps to visualize all the events that share the responsible (principal in Google SecOps) process's UUID.
Query — Google SecOps
The results of this search can be analyzed in a pivot view as shown above or in a timeline view, either one providing crucial context for investigation. In a timeline view events leading up to the alert should be inspected to determine how the suspicious activity originated, helping answer key questions about what triggered the warning.
Meanwhile, events that occurred after the alert may reveal additional malicious actions, such as persistence mechanisms, data exfiltration or lateral movement. Identifying these post-alert activities ensures that all potential threats are uncovered and properly remediated.
Conclusion
The enhanced telemetry feature in Jamf offers countless ways to craft meaningful detections by combining different fields. These searches enable us to investigate suspicious or unexpected activity and uncover valuable insights about what’s happening across our fleet. Beyond security investigations, telemetry also plays a crucial role in meeting various compliance benchmarks, ensuring your organization adheres to necessary standards.
Did we spark your interest? If you’re not yet using telemetry, there are many options for integrating it with third-party solutions like Google SecOps, Microsoft Sentinel, Elastic or Splunk. If this all seems overwhelming, a great starting point with a shallower learning curve is to enable local log file storage. This allows you to analyze your own machine’s telemetry data first, providing a hands-on way to explore telemetry before scaling up to a broader fleet-wide implementation.
Get powerful event analysis with Jamf telemetry.
Try it for yourself.