

I have spent the last few days improving the collection and analysis features of the original powermetrics command to better support Splunk ingestion.
The downside to the new approach is that new commands must now be run as a script; the upside is that we now have easy access to timestamped energy impact data that is very easy to parse and chart in any log analytics tool. I know Splunk the best so I use it in the examples below, but the energy data is completely portable.
Note: This script generates a fair bit of data, I recommend you limit your deployment of this to only a few machines.
Why the change to a script?
The answer has to do with how LaunchDaemons are loaded without a shell environment. My solution to add timestamps is very simple but relies on a shell output redirect - aka “pipe” - to have the sed command prepend the date to each output line. Pipes and other output redirection are not supported by LaunchDaemons directly but there are some workarounds.
For example, the following would not work in a LaunchDaemon but will work in a terminal or other shell environment.
The good news? Loading a shell script via a LaunchDaemon side-steps these limitations and is what Jamf uses to be able to remotely run commands and scripts from the controlling LaunchDaemon. I will detail why this works and the intricacies of LaunchDaemons/Agents in a later blog post.
By loading the new powermetrics collection command as a script, we are also able to create a "while" loop to handle the date command generating the proper date and time for each line.
How To: Install the Script
1. Create the file /usr/local/bin/powermetrics_custom.sh with the following contents:
2. Create the file /Library/LaunchDaemons/com.cmdsec.energyimpact.logger.plist with the contents:
3. Important! Set permissions on both files using the commands below:
4. Load the LaunchDaemon and start powermetrics collection using the command below:
Parsing the Data in Splunk
When uploading or indexing the powermetrics data into Splunk, make sure to select “generic_single_line” as the source type. The output will be slightly messy on the lines not containing the actual energy impact output. This is its normal behavior and will not affect the data itself.
At this point in the process, you will have lines of text in Splunk with the correct timestamps, but Splunk will have no idea which value is which field. In the next step, we will define field extractions via a regular expression to tell Splunk how to map fields to values.
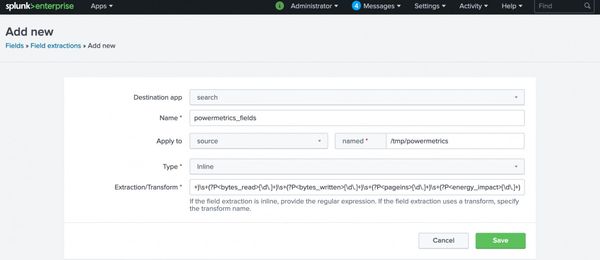
To extract the fields required for analysis, navigate inside the Splunk web console to: Settings > Fields > Field Extractions (add new)
Configure the field extraction options using the code block below:
Analytics Basics
If you are an advanced Splunk user, the data will be properly key/value mapped and any Splunk analytics searches or functions will work. I have detailed one of the easier and most useful commands for this analysis below.
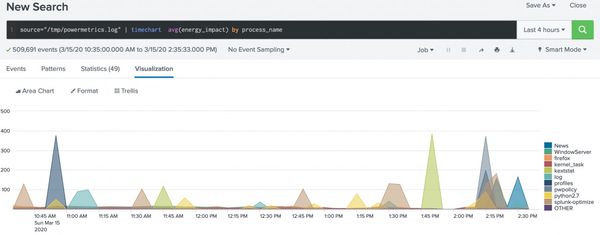
To map out the energy impact score over time the best tool in Splunk is the “timechart” command (as shown in the screenshot above). Click Search in the top left of the Splunk console to be presented with a search field, enter the text below and press enter.
The command above performs the following steps:
- Pipe output of ‘source=”/tmp/powermetrics.log”‘ to the timechart command
- Average the energy_impact score by x-axis time frame, or span
- Track each process_name separately
To narrow the search to one or a few processes, the first part of the search may be modified in the example shown below:
And lastly, to search on total combined energy impact:
Time on the x-axis
Timechart will automatically determine the best resolution for the x-axis based on the time frame of the search. For example, if the search is for the past 24 hours, the x-axis will be in one-hour steps. Similarly, if the search is for the past 60 minutes, then steps will appear in minute increments. Energy impact data is collected every 60 seconds, so any span that is less than 60 seconds will output misleading data.
You can manually specify the x-axis steps with the ‘span=1h’ option to timechart. A basic example would be “timechart span=1h avg (energy_impact) by process_name”. More details about the span option can be found in Splunk's documentation.
Happy charting!
Interested in charting the health data of your endpoints in real time?
Get started securing and monitoring your endpoints today with Jamf Protect!
Subscribe to the Jamf Blog
Have market trends, Apple updates and Jamf news delivered directly to your inbox.
To learn more about how we collect, use, disclose, transfer, and store your information, please visit our Privacy Policy.