
Watch this JNUC session in its entirety.
At JNUC 2016, Fletcher Previn, VP of Workplace as a Service at IBM revealed the wildly successful results of their Mac@IBM program, but how exactly did they do it? That was the topic of conversation at the Mac@IBM - Under the Hood session. The Mac@IBM Engineering team provided JNUC attendees a glimpse under the hood, including some of their technical thought process, their challenges, best practices, and successes in delivering a great Mac user experience at scale.
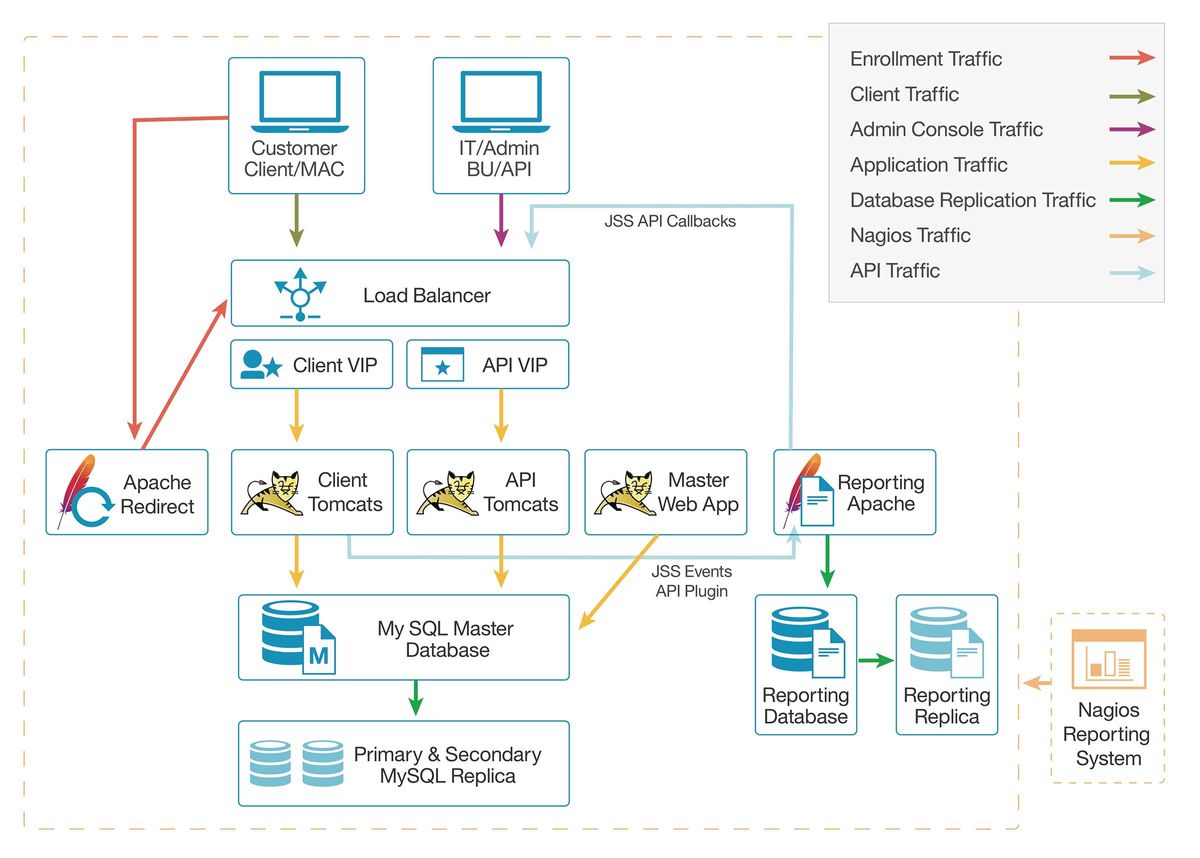
On hand to explain it all were IBM engineers Ryan Gorman, Patrick Norton, Thomas Larkin, J.D. Palmer and Tom Lenz. They kicked off their session with an overview of their infrastructure, which is comprised of 4 key server groups: Production; QA; Engineering; and Tools. These servers run RHEL and include a Failover Design that clusters Tomcats such that entire apps can fail without impacting end users.
Next, Patrick Norton hopped onstage to talk about monitoring and metrics, explaining that monitoring provides alerts when certain criteria or thresholds are met, whereas metrics are comprised of historical data tracking used for business intelligence purposes.
They added that monitoring allows them to be alerted for immediate concerns, though it doesn’t help for long-term planning. They said in order to plan effectively, they need to better understand the patterns of the JSS, as well as the effects of policy executions.
“Collecting metrics gives us the historical data that we need to forecast future load, infrastructure health and make informed decisions on that data,” Patrick said.
What does Mac@IBM monitor? System Resources, Network Connectivity, Database Health and Web App Health. To do this monitoring, they use a combination of Nagios, the Nagios Remote Plugin Executor (NRPE), Community and Custom Plugins, and the Jamf Events API.
With monitoring, the team said their biggest challenge is determining thresholds. “The toughest part of alerts and monitoring is figuring out what those thresholds are. It’s a tough balance as the infrastructure goes and you’re constantly checking thresholds” explained Pat.
They suggested always keeping two questions in mind:
- What do you need to know about now versus in a few hours?
- What do you want to wake you up at night?
“We use email and SMS alerts based on the severity of the threshold. At night, SMS wakes me up if I’m sleeping, email doesn’t wake me up.” – joked Patrick.
When it comes to metrics, the team collects: Events; Systems; Database; and Network. But how do you make sense of it all? They recommend a few options, including graphing, analyzing historical data and utilizing a dashboard.
“Historical data is crucial for analyzing trends and identifying changes that have caused adverse effects on system health.” The dashboard, they added, shows 4-hour snapshots of the metrics they watch most closely.
The Mac@IBM showed the audience that when it comes to metrics, looks matter. “Metrics are great, but we took on the challenge of finding something ‘prettier’.” Said Ryan Gorman. They chose dashboard tool Tipboard and leveraged the Jamf API and give them a better visual to review and share with management.
The team frequently uses Events API to receive real-time information, along with the benefits of using a Main Policy Model.
Tom dove into the Main Policy Model, perhaps one of the most unique aspects of the Mac@IBM implementation. Most organizations create multiple policies in Jamf to trigger a multitude of actions, but with the Main Policy model, the Mac@IBM team only uses 4.
“The key for it all goes back to the Main Policy. By doing everything in there, we don’t have to spend time updating so many policies.” explained Tom.
But, as with anything, it’s only great if it actually works. In order to ensure their own process is up to par, the team discussed a QA workflow that includes testing and validation, change management, documentation and a pilot.
The most critical metric to successful QA? Customer satisfaction. “QA isn’t just an engineering process, it’s about quality and making enhancements to what we offer customers. We’re constantly listening to feedback to improve the process.” explained JD Palmer.
Some of this feedback comes from their 840 member Mac Community Council, a group of IBMers who volunteer to test new Mac@IBM releases before a general release is available. “We’re an agile development team. Iterating makes the product better and allows us to create the best customer experience possible” said JD.
Mac@IBM started with just a few people and even today their team is small and spread out, but they are all 100% dedicated to Mac@IBM. And while the Mac@IBM project is compelling, not every organization has the staff to dedicate to and execute this type of project. Mac@IBM’s advice for understaffed organizations? “Leverage your partners: IBM GTS, Jamf Pro Services, Apple pro services, even Jamf Nation.”
Subscribe to the Jamf Blog
Have market trends, Apple updates and Jamf news delivered directly to your inbox.
To learn more about how we collect, use, disclose, transfer, and store your information, please visit our Privacy Policy.